Open-Source Observability for AI Agents
May 15, 2026 · 5 min read
Observability is non-negotiable for AI agents of any shape or size. Without observability, the agent is a black box that burns tokens. It picks tools, branches, retries, and rewrites its own plan, and it cannot be debugged, evaluated, or improved.
Motus agent tracing is our observability layer. It records every step of a run in detail: model invocations, tool calls, sandbox interactions, sub-agent actions, retries, errors, and task transitions. Those steps are exposed through a span model that shares the same core across local development and cloud deployment. It works with any framework, whether Motus-native agents or agents built on the OpenAI Agents SDK, the Anthropic SDK, the Google ADK, or plain Python. The entire tracing stack is fully open source and free to use.
The design is shaped by three constraints. First, instrumentation must impose no setup cost: anyone building agents should be able to inspect a run the moment a problem appears, without any agent modifications. Second, the trace produced locally and the trace emitted from a deployed agent must share the same schema, so the analysis tooling, the debugging workflow, and the downstream evaluation pipeline all operate on one representation. Third, telemetry is not only for debugging but for improvement. The same spans that surface a failure should feed your favorite coding agent when iterating on the agent, or power more advanced techniques like Learning Agents.
Local Tracing
Local tracing ships as part of the open-source motus Python package. It is enabled with a single environment variable:
MOTUS_TRACING=1 uv run python agent.pyThe runtime writes a self-contained trace_viewer.html file to disk. Opening it renders the complete span tree for the run, including model calls, tool calls, durations, token counts, and payload contents. No server, network connection, or account is required.
For interactive sessions in which spans should appear as the agent executes, the runtime exposes a streaming variant:
MOTUS_TRACING_ONLINE=1 uv run python agent.pyThis starts a local viewer backed by Server-Sent Events. Spans are pushed to the browser as they close, allowing the developer to inspect partial state, identify hangs, and observe errors without waiting for the run to terminate.
Cloud Telemetry
The same agent source runs locally under motus serve and in Motus Cloud under motus deploy:
motus deploy --name support-agent agent:agentIn the deployed environment, the runtime emits traces continuously and tags each one with project, build, and session identifiers. There is no second SDK to integrate and no conditional code path for production. The same span emission that produces trace_viewer.html locally produces the cloud trace stream, ensuring that an engineer comparing a local reproduction to a production failure is comparing structurally identical records.
The local and cloud boundaries are kept strictly separate. Traces generated by motus serve or by direct invocation remain on the developer's machine even when the user is authenticated; cloud upload occurs only inside the deployed cloud runtime. This separation is deliberate: development traces frequently contain unredacted prompts, synthetic test data, and incomplete experiments that should not be transmitted off-host.
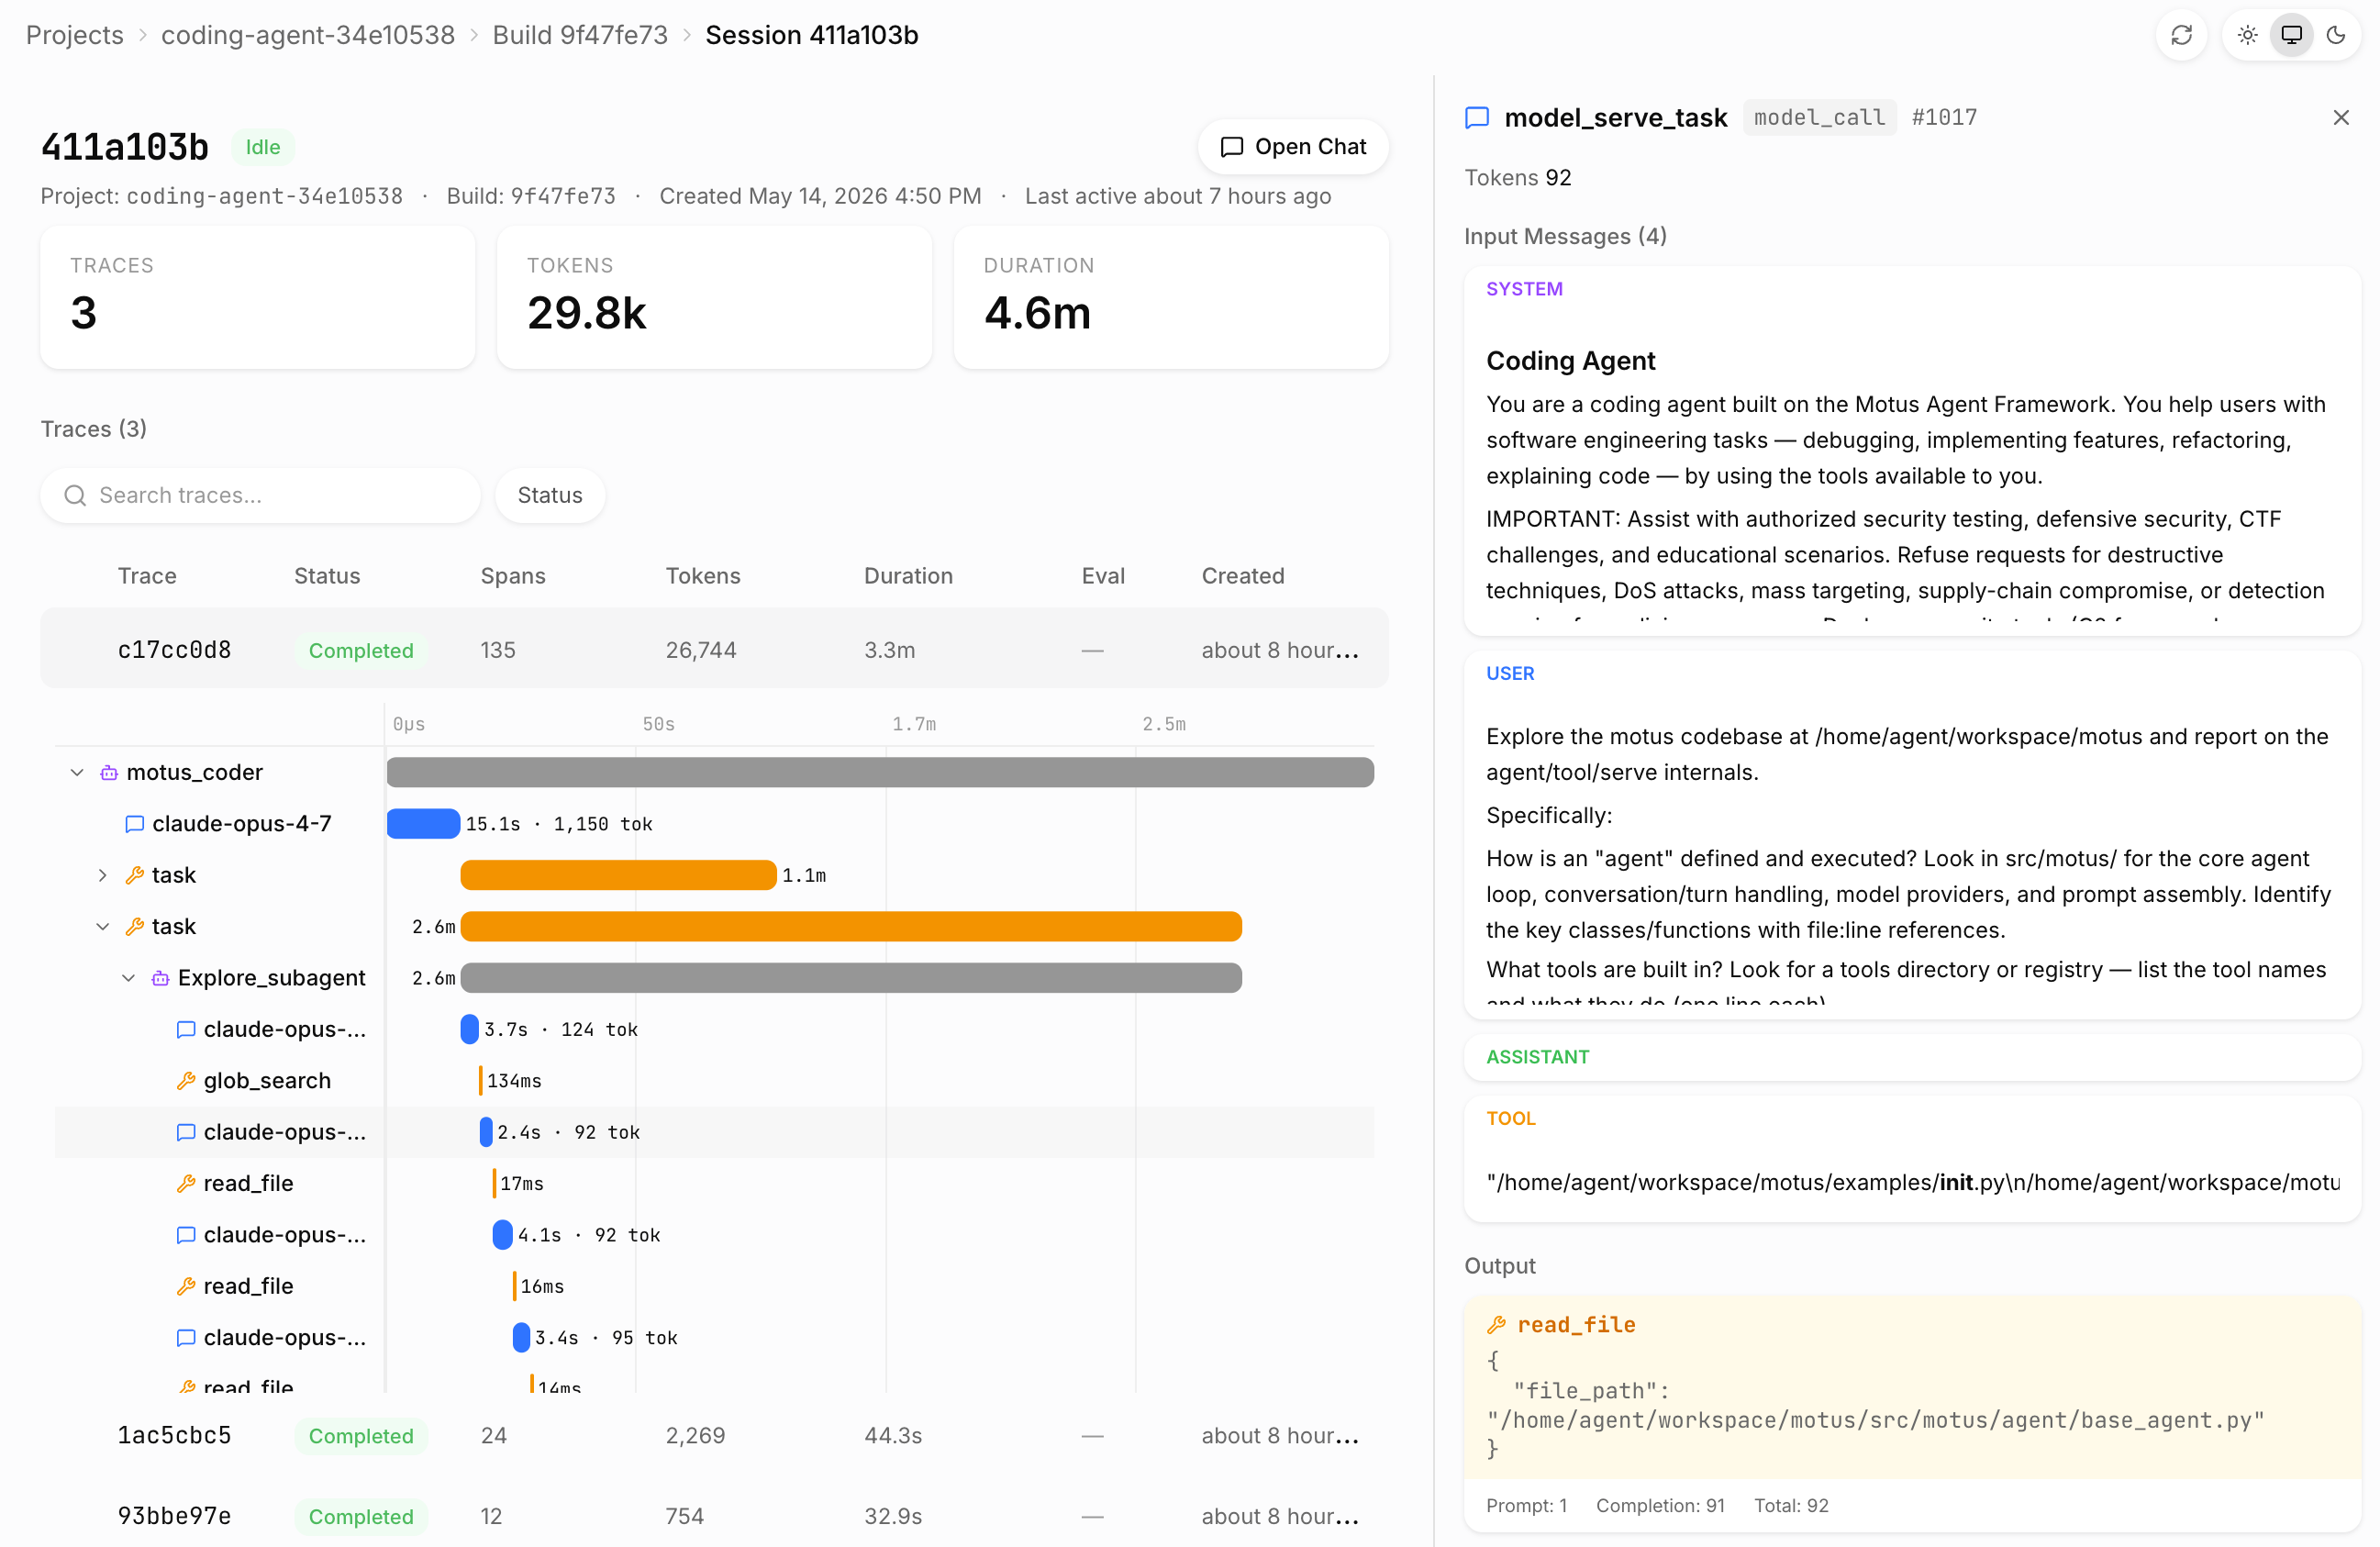
The Span Model
The trace viewer is organized around a hierarchical span tree. Each span belongs to one of three classes:
- Model spans record the input messages, the generated output, the tools made available, token usage, and inference cost.
- Tool spans record arguments, return values, raised exceptions, and execution time.
- Task spans group model and tool spans into logical units of work, preserving the agent's reasoning structure.
The viewer renders these spans as a timeline alongside the tree, so latency outliers and error sites are visible without inspecting individual payloads. The same view answers the questions that dominate agent debugging: what the model received, which tool it selected, what arguments it passed, what was returned, where time was spent, and which step failed.
Framework Independence
Instrumentation is implemented at the runtime layer rather than inside any single agent framework. Agents written with the Motus-native ReActAgent and @tool decorators are supported, as are agents built on the OpenAI Agents SDK, the Anthropic SDK, the Google ADK, or plain Python. Once an agent is served by Motus, the operational surface—sessions, traces, spans, deploys, and the cloud UI—is identical regardless of the upstream framework.
Traces as the Substrate for Learning Agents
For Learning Agents, traces provide the primary feedback signal. The optimizer relies on production traces to identify failure modes, attribute cost, sample representative inputs, and quantify behavioral differences between candidate versions.
Because the trace schema is invariant across environments, the same spans an engineer inspects in the viewer become inputs to regression sets, error-driven datasets, traffic-sampled datasets, and cost-focused datasets. Debugging an individual run and improving the next deployed version draw from a single source of evidence.
Open Source, Available to Everyone
Motus tracing is open source under a permissive license. The Python runtime instrumentation, the span schema, and the local trace viewer all live in the lithos-ai/motus repository. Installing the package is sufficient to capture, render, and stream traces for any agent, on any machine, with no account and no network dependency. Self-hosted deployments running under motus serve retain the same tracing surface as the managed cloud; the cloud adds hosted retention, multi-session indexing, and the integration with Learning Agents, but the underlying observability is available to every developer running the open-source runtime.